Install Datadog Agent to monitor your Server
How to install Datadog Agent on Amazon Linux server? How to configure Datadog to send Infrastructure metrics?
In this tutorial, I will install Datadog Agent to monitor my Amazon Linux server. To follow along, you’ll need to sign up for a Datadog account. Don’t worry, Datadog has a free trial, so you don’t pay anything while you continue to learn. And their Free plan for infrastructure monitoring includes up to 5 hosts with 1-day metric retention.
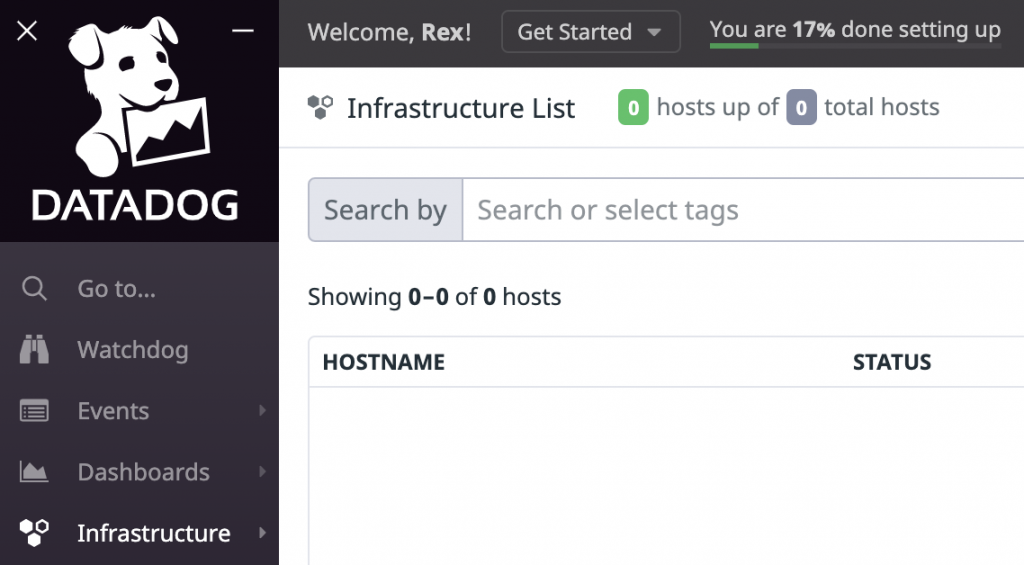
Go to the Infrastructure page. Since I’m using a new account, you can see that I have zero hosts being monitored here. Datadog has different instructions on installing the agent depending on your host server or platform (e.g.: Linux server, Windows, AWS Lambda, K8, Docker, etc.).
Install Datadog Agent in Amazon Linux server
Go to Integrations, Agent page, under “Agent 7 Installation Instructions”. We’re going to follow the steps for Amazon Linux.
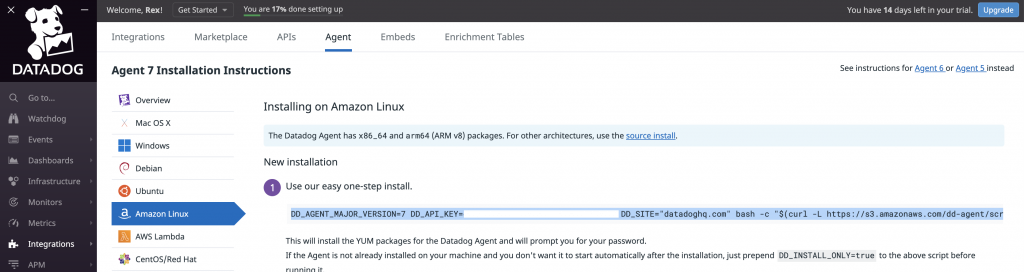
DD_AGENT_MAJOR_VERSION=7 DD_API_KEY=exampleapikey DD_SITE="datadoghq.com" bash -c "$(curl -L https://s3.amazonaws.com/dd-agent/scripts/install_script.sh)"
On the above example installation command, notice the following important environment variables.
- DD_AGENT_MAJOR_VERSION – Datadog agent version to install. As of writing this blog the latest version is 7.
- DD_API_KEY – Datadog API Key associated with your account.
- DD_SITE – Destination site for your metrics, traces, and logs.
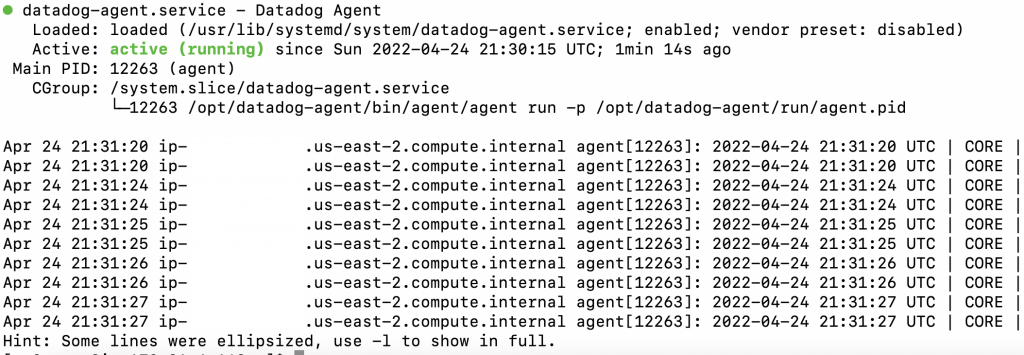
Copy and paste the installation command in your host server. Once the installation is complete, check if the system process of your Datadog agent is running.
systemctl status datadog-agent
Also, all the configurations related to your Datadog Agent are located in the folder /etc/datadog-agent including the datadog.yaml file. You will have to modify this file if you decide to enable other Datadog services like Log Management.
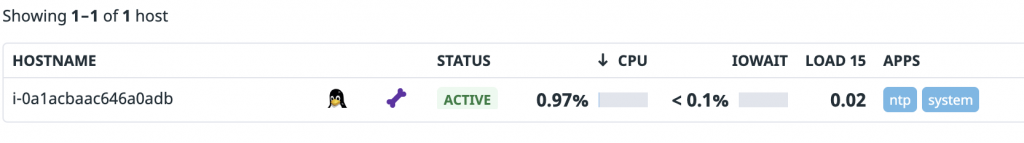
Give it a couple more minutes after you have verified that the agent is actually running. Then, refresh the Infrastructure page again in your Datadog account. If everything is set up properly, you should see that your host has been added!
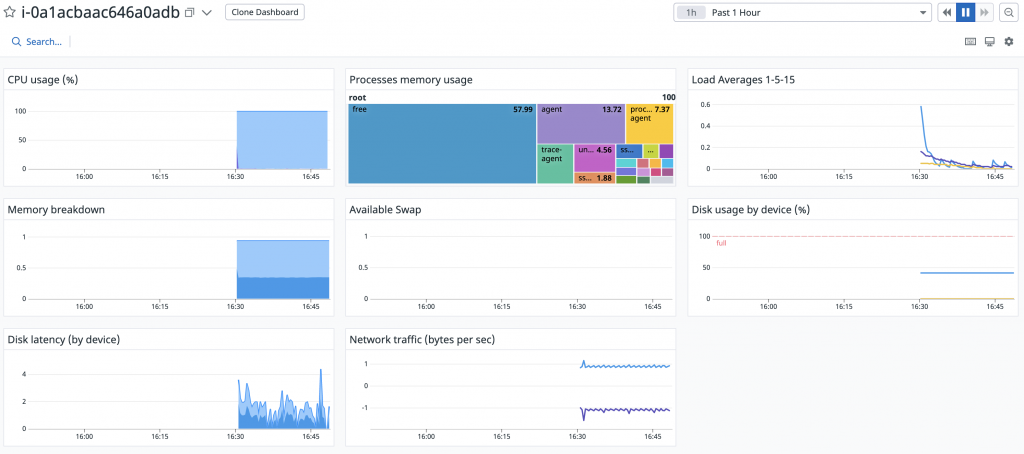
And if you go to your host dashboard, you will find all the default metrics that are already being monitored such as CPU, Memory, Disk usages and Network traffic.
In my next tutorial, I’ll discuss how you can integrate monitoring into a Web application, using Datadog Application Performance Monitoring (APM).